
Oil prices are influenced by a wide range of dynamic and interrelated factors including but not limited to geopolitical events, supply and demand shifts, speculators, hedgers, and even trader sentiment. These elements all contribute to significant short-term price movements including daily rallies or declines. Despite their unpredictability, large price swings in oil show signs of mean reversion, allowing for statistical approaches to examine how oil prices historically have behaved in the days following. To assess whether there are any short-term trading opportunities that can be identified, large price movements were separated into two groups; +2 standard deviation moves and -2 standard deviation moves, and daily price returns for the following three days for each respective grouping was analyzed.
Return Distribution after a +2σ Price Movement
Using historical natural oil futures daily prices from December 31, 2013, to March 31,2025 looking into the 3 days following a large positive oil price movement, which can give insights on timing a position after such a movement. The distribution for T+1 oil price returns is centered around a slightly negative mean of -0.451%, with left negative skewness and a longer left tail which point towards an immediate negative reaction following a large positive price movement. This brings an opportunity for traders to fade the spike depending on the reason for underlying initial upward pressure. An interesting feature in comparing the distributions comes on T+2 where we see a shift in the to a positive mean return, a positive right skew, and a larger positive tail. Contingent on the underlying initial pressure, a return to positive momentum is being displayed after the negative reaction on T+1. Herein lies a chance for traders to take advantage of the potential upward movement by enter a short-term long position using CLUP. T+3 is when we begin to see more standard normal market price movements where we are centered around slightly positive returns, symmetrical and less volatile but still has a slightly longer and fatter negative tail.

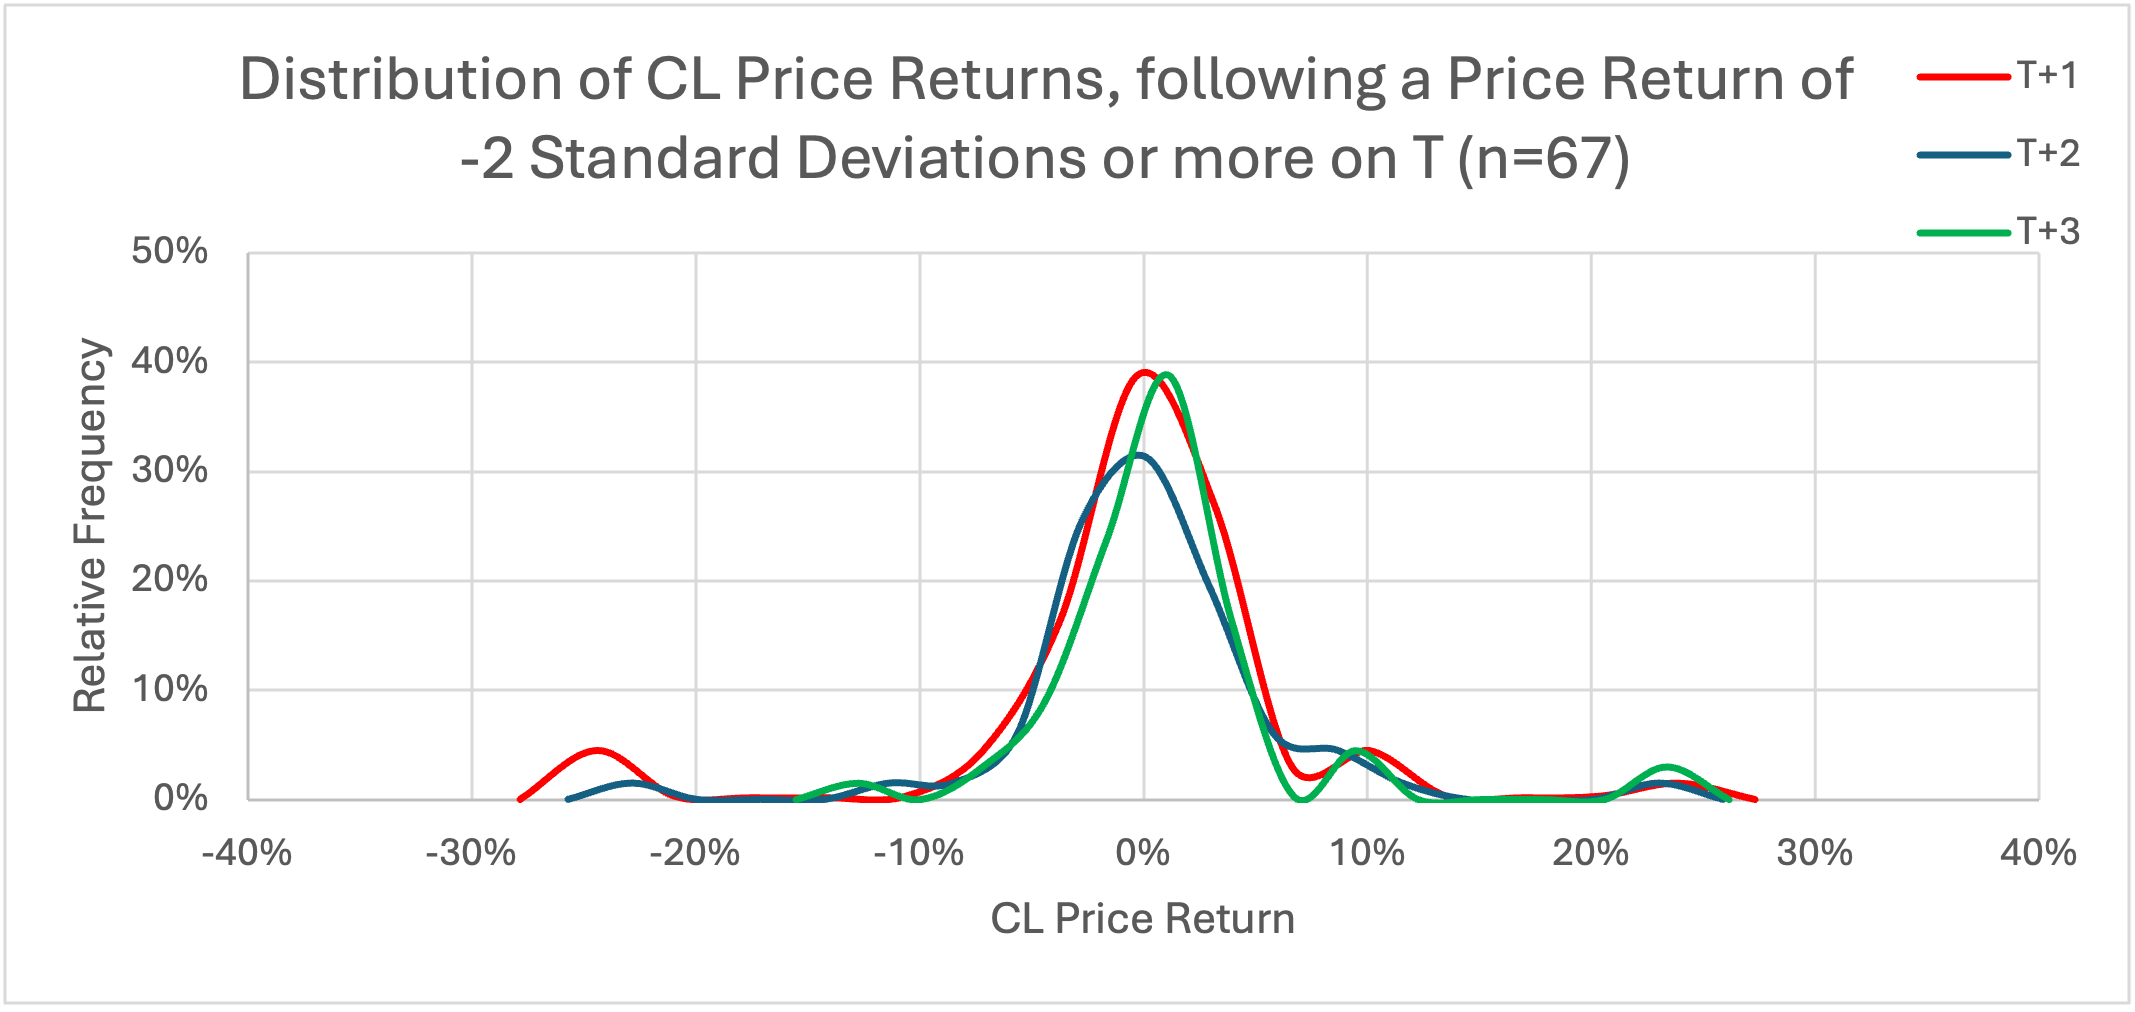
Return Distribution after a -2σ Price Movement
In the case of the days following a -2 standard deviation or more on T, there are no statistically significant insights prevalent. Disregarding for the extreme tail behaviour due to COVID-19 related events, there is no discernible directional bias of the price returns in the days following a large negative price movement. Returns after a large negative price movement are centered around 0% with low volatility and symmetrically distributed. There is slight potential for larger positive returns than its negative counterpart, but the frequency difference in the distribution is marginal.
Analyzing oil price behavior following large daily moves provides important context for traders considering short-term strategies. Historical data reveals that after a +2 standard deviation move, oil prices often exhibit an immediate corrective phase, followed by a potential recovery or continued upward momentum — creating opportunities for tactical positioning depending on the underlying catalyst. This pattern gives traders an opportunity to enter short positions on T+1 and then shift into long positions for the potential rebound on T+2. Conversely, after a large negative price movement, market behaviour appears more neutral, with less volatile returns centered around 0% and no strong directional bias. In conclusion, mean reversion tends to occur more quickly after large positive moves compared to the more gradual and controlled stabilization that follows major declines. Being aware of the cause behind large price movements, and the factors driving them, is essential for a trader’s positioning and outlook.
Our SavvyLong Crude Oil ETFs; CLUP and CLDN seeks to replicate, to the extent possible, up to two times (2X/-2X respectively) the daily performance of the Solactive Crude Oil Rolling Future index, SOLOIL, which tracks Crude Oil Futures on a rolling basis. Position yourself to benefit from our leveraged Crude Oil ETFs which provide high conviction traders with the ability to benefit from oscillating prices of either direction.
If you hold leveraged and inverse ETFs for more than one day, your return could vary considerably from the ETF's daily target return. The negative effect of compounding on returns is more pronounced when combined with leverage and daily rebalancing in volatile markets.
Leveraged ETFs are a convenience tool for traders, providing a solution that does not require direct margin from security holders. Trading on the exchange just like a stock means that traders have an easy-to-use solution.
At LongPoint, we saw the gap in the Canadian marketplace for competition in exposures with higher volatility than equity markets and launched the Savvy Geared ETFs that provide either two times long or two times inverse exposure to natural gas and crude oil futures.
Commissions, management fees, and expenses all may be associated with investment funds. Investment objectives, risks, fees, expenses, and other important information are contained in the prospectus; please read it before investing. Investment funds are not guaranteed, their values change frequently, and past performance may not be repeated. LongPoint funds are managed by LongPoint ETFs and are available across Canada through registered dealers.
This material is for informational purposes only. This material is not intended to be relied upon as research, investment, or tax advice and is not an implied or express recommendation, offer or solicitation to buy or sell any security or to adopt any particular investment or portfolio strategy. Any views and opinions expressed do not take into account the particular investment objectives, needs, restrictions, and circumstances of a specific investor and, thus, should not be used as the basis of any specific investment recommendation. Investors should consult a financial and/or tax advisor for financial and/or tax information applicable to their specific situation.